Each spring, smolts leave the Miramichi River to journey to the ocean, where they will grow to become adults and eventually return to the river. During the spring run, the Miramichi Salmon Association conducts smolt population estimates on the Miramichi River using a mark-recapture system. Through this program, we are able to calculate an estimated number of Atlantic Salmon smolts (age 2-3 years) as they leave specific rivers in the Miramichi to continue their journey into the Atlantic Ocean. This valuable information helps conservation groups and regulators make important decisions about the management of the Miramichi watershed.

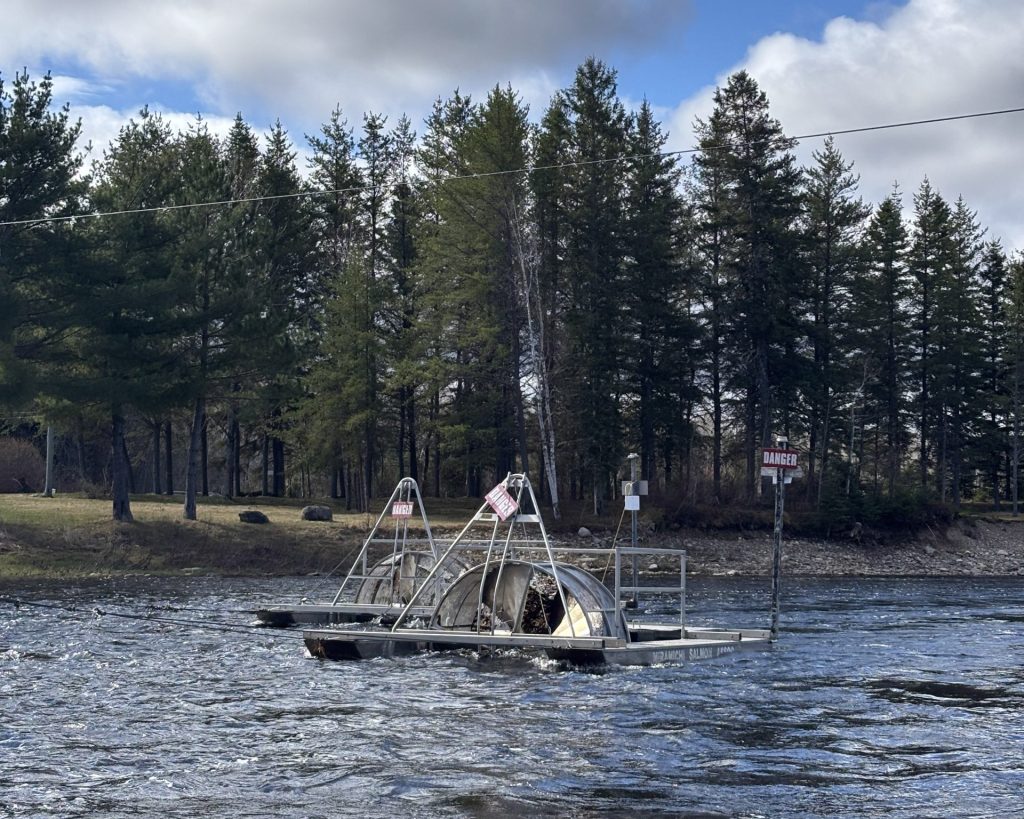
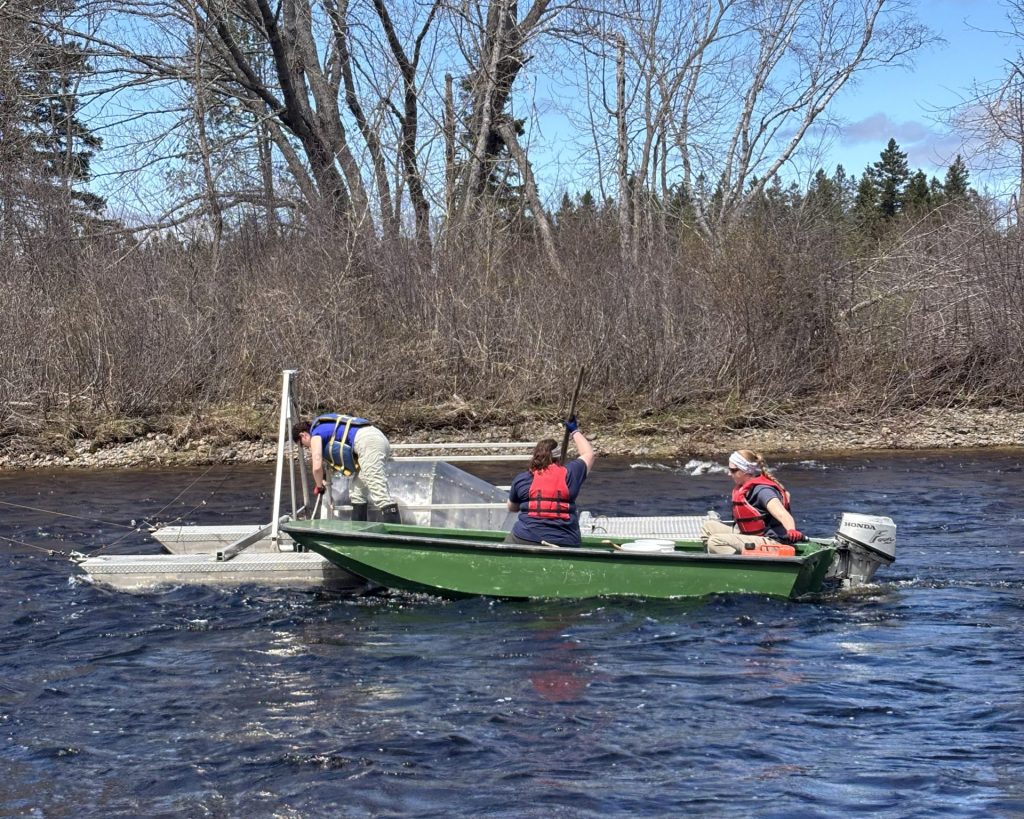
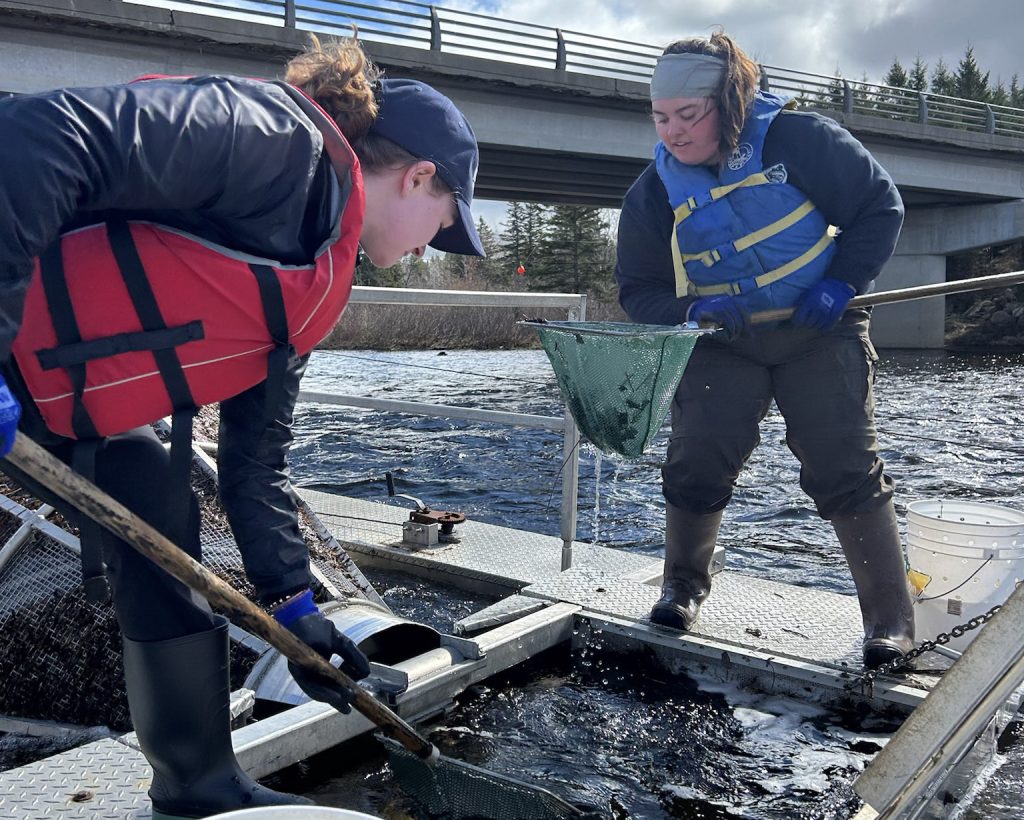
The MSA puts rotary screw traps, known more commonly as smolt wheels, on the Miramichi River to capture fish for smolt estimates. These smolt wheels remain on the water from the beginning of the smolt run until the end.

A smolt wheel looks like a large funnel. The big end of the wheel faces upstream and the river current makes the wheel rotate. Fish swimming downstream are gently directed by the wheel’s rotation into a holding well. Smolt wheels can capture anywhere between a few to several hundred smolts per day, depending on weather conditions and the time of year.

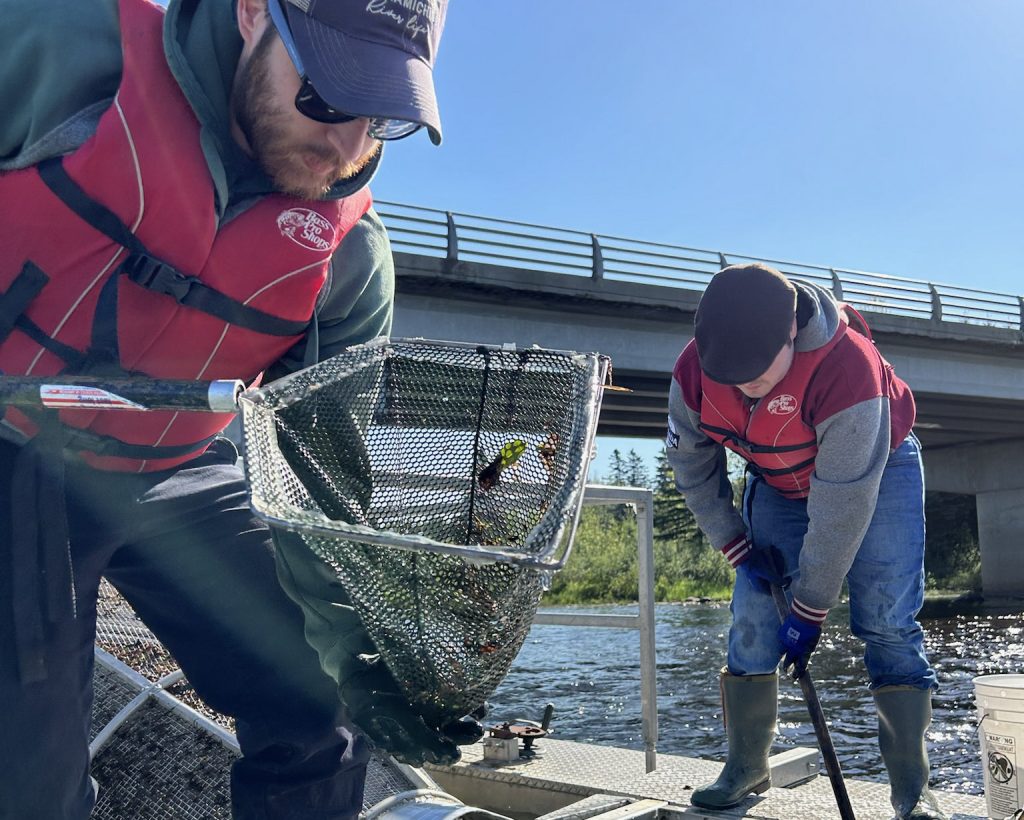
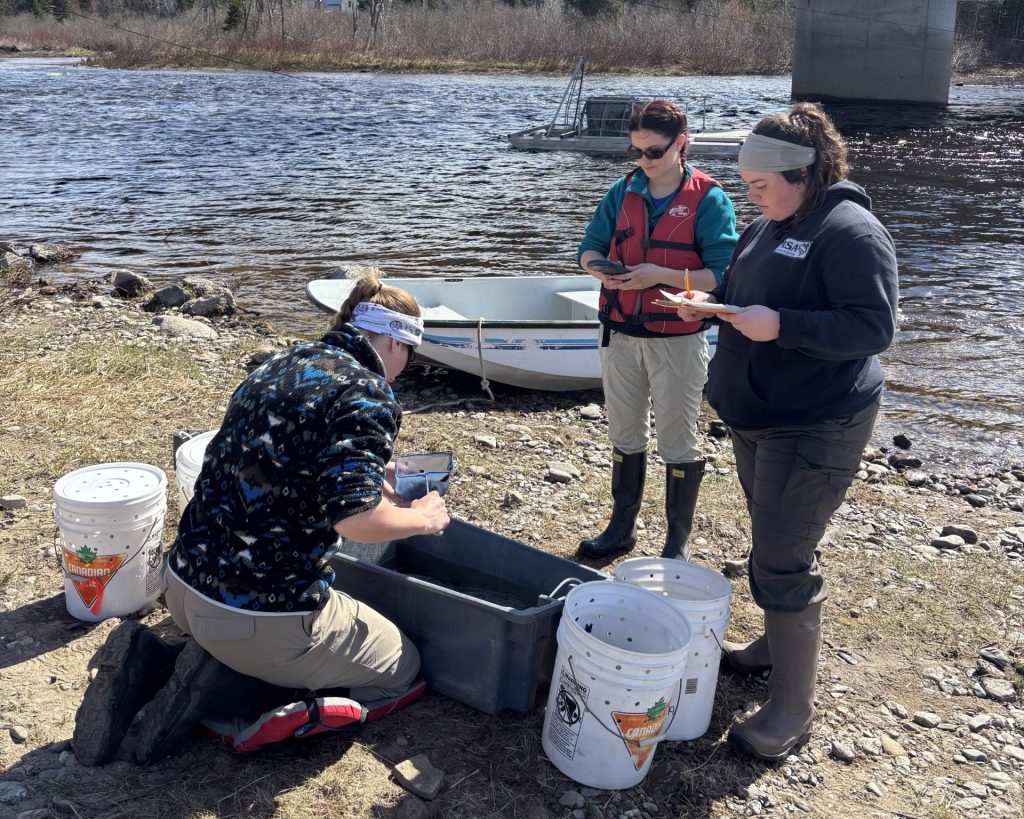
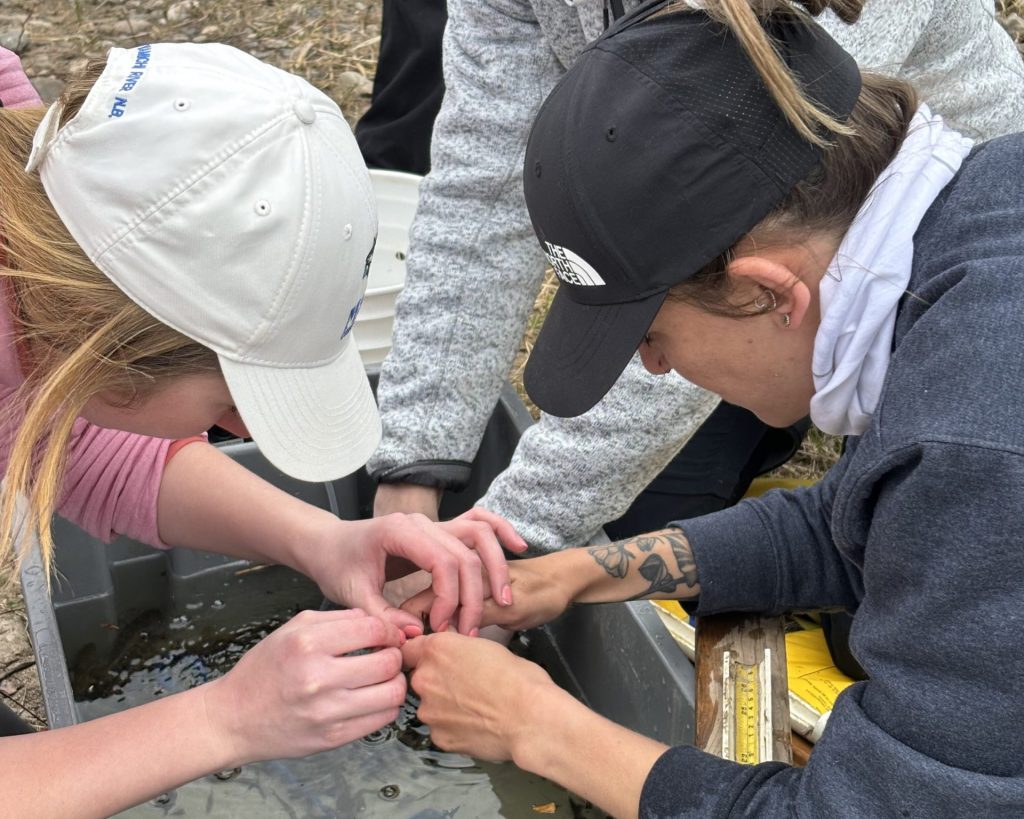
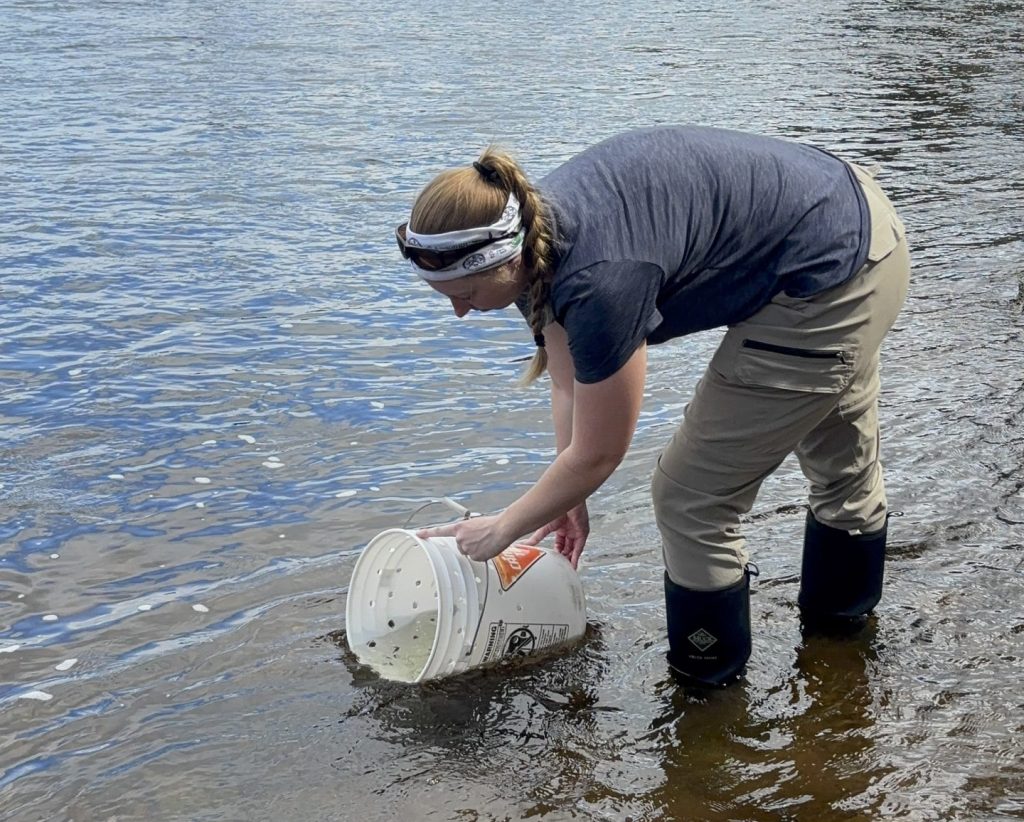
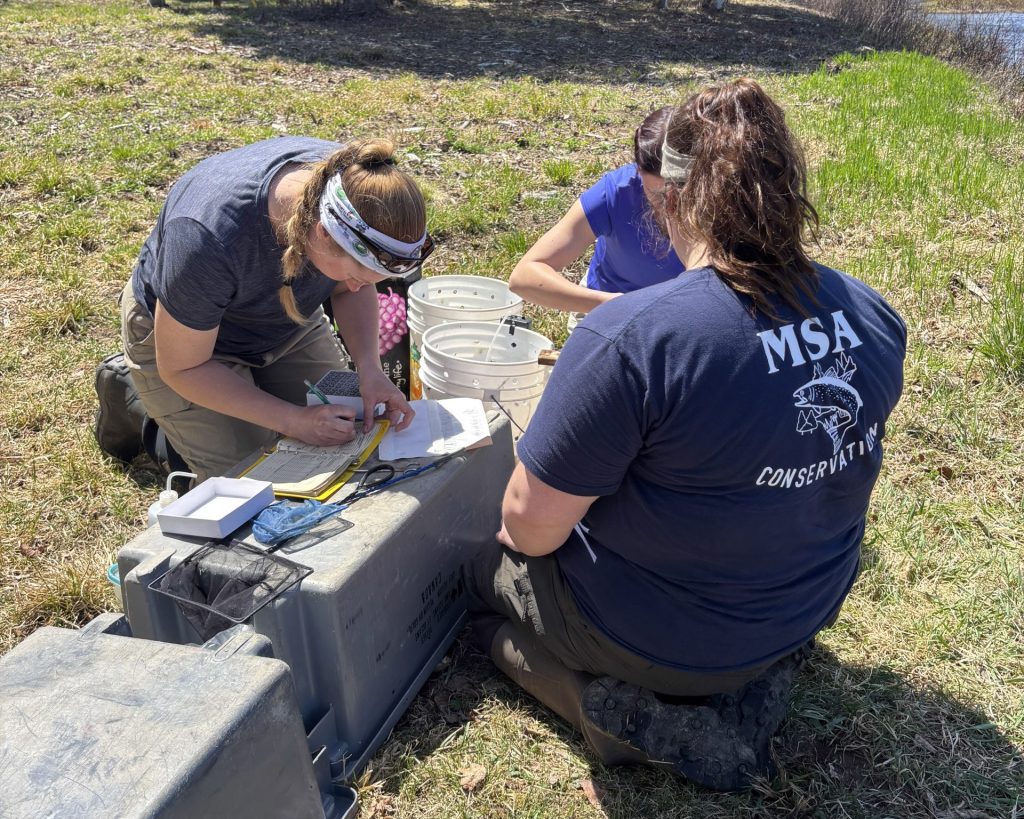
Smolts captured in the smolt wheel are brought to shore to be counted and each fish is measured. Scale samples are taken to determine the smolt’s specific age. The Miramichi Salmon Association then applies a “streamer tag” (a type of tag that falls off naturally in the water after a period of time) to each smolt. Regardless of how many smolts are captured each day, field workers only tag up to 100 smolts per day to limit the number of fish being handled. Any untagged smolts are released where they were captured. Tagged smolts are released further upstream, about 5km from the site where they were captured. It takes tagged smolts about a day to reach the smolt wheel again where they will be recaptured. This method of capturing, tagging, and recapturing smolts is called the “Mark-Recapture” strategy. 

The MSA uses three key pieces of information to figure out how many smolts left the river during the spring run:
1) The total number of fish captured in the smolt wheels,
2) The total number of fish that were tagged,
3) The total number of fish that were captured a second time.

These three numbers are put into a system that uses information about smolt runs and mortality to calculate a smolt population estimate. 

2022 Smolt Estimate Report

The Northwest smolt wheels operated from May 3rd to May 28th, 2022. A total of 1,673 smolts were tagged on the Northwest River and 147 smolts were recaptured. The peak of the smolt run occurred on May 14th, with a combined total of 1,069 smolts captured (Figure 2). Due to lowering water levels, both wheels were readjusted as needed to achieve proper rotations per minute (RPM) and ensure safety protocols were met. A total of 2,039 smolts were captured through Wheel 1 at Wayerton and 48 smolts were recaptured. A total of 3,767 smolts were captured and 99 smolts were recaptured through Wheel 2. Applying a 10% mortality rate to our population estimate (using the Bayesian method), it was estimated that 42,300 …

2021 Smolt Estimate Report

The Northwest smolt wheels operated from May 3rd to May 28th, 2021. A total of 1,370 smolts were tagged on the Northwest River, and 109 smolts were recaptured. The peak of the smolt run occurred on May 7th, with a total of 812 smolts captured (Figure 2). Due to lowering water levels, both wheels were readjusted to achieve proper rotations per minute (RPM) and ensure safety protocols were met.    A total of 1,268 smolts were captured through Wheel 1 at Wayerton, and 45 smolts were recaptured with Wheel 1. A total of 1,499 smolts were captured, and 64 smolts were recaptured with Wheel 2. Applying a 10% mortality rate to our population estimate (using the Bayesian method), it was estimated that 27,900 ...

2018 Smolt Tracking Study

Survival numbers from the 2018 tagging study are less than desirable for the Miramichi River, similar to the numbers recorded in 2017. The fish that successfully survived tagging (a 10% mortality rate is assumed for tagging studies) and were detected exiting Miramichi Bay was only 16%.  The highest areas of loss on the Northwest were between Hacketts Beach and Loggieville (67 fish/84%) where striped bass are most prevalent (Figure 2a). The highest survival rate was observed between Millstream and Hacketts Beach, as only 2 fish (3%) were lost. On the Southwest branch the highest areas of loss were between Millerton and Loggieville (32 fish/40%) (Figure 2b). The highest survival rate was observed between ...

2017 Smolt Tracking Study

Survival numbers from the 2017 tagging study are less than desirable for the Miramichi River, similar to the numbers recorded in 2016. The fish that successfully survived tagging (a 10% mortality rate is assumed for tagging studies) and were detected exiting Miramichi Bay was only 11%. The highest areas of loss on the Northwest were between the head of tide at Cassilis and Nelson (37 fish/30%) where striped bass are most prevalent, and from the tagging location at Miner’s bridge to Cassilis (27 fish/34%) (Figure 2a). The highest survival rate was observed between French Fort Cove and Loggieville, as only 2 fish (3%) were lost. For the Northwest River in total, 0.88 smolt/km were lost. On the Southwest branch the highest ...

2016 Smolt Tracking Study

The three main questions that were trying to be answered during the 2016 smolt tracking study were as follows: 1. Is there an effect on survival when fish are tagged in the winter vs. tagged in the spring, when both groups have been kept in captivity? (Captive-Winter vs. Captive-Spring) 2. Is there an effect on survival when fish are kept in captivity, tagged, and remain in captivity until being released vs. fish that are caught from the wild, tagged, and released the same day? (Captive vs. Wild) 3. Is there an effect on survival when wild fish (no time spent in captivity) are tagged and released during the day of tagging vs. the night of tagging? (Wild – Day vs. Wild – Night). Northwest 1. The Captive-Winter group of fish ...

2015 Smolt Estimate Report

The Miramichi River needs 1.8 million smolt migrating to the ocean every year in order to sustain a healthy adult population – roughly 1.2 million from the Southwest branch and 600,000 from the Northwest. The standard estimate is 3.0 smolt/100m2 . In 2014 the trap net was relocated to Chatham, however no estimate could be produced because of the high volume of fish caught – too many for our crews to sample, and the net had to be dumped out. The three years of data from the Northwest system before that have shown variable and sometimes conflicting results; in 2011 and 2013 smolt production exceeded 3.0 smolt/100m2 and in 2012 was estimated at only 2.0 smolt/100m2 . Difficulties with equipment ...

2015 Smolt Tracking Study

Survival numbers from the 2015 tagging study are less than desirable for the Miramichi River, however they were better than numbers recorded in 2014. The fish that successfully survived tagging (a 10% mortality rate is assumed for tagging studies) and were detected exiting Miramichi Bay was only 36%. The highest areas of loss on the Northwest were between the head of tide at Cassilis and Nelson (18 fish/23%) where striped bass are most prevalent, and from the tagging location at Miner’s bridge to Cassilis (17 fish/21%) (Figure 2a). The highest survival rate was observed between Loggieville and the estuary receivers, as only 2 fish (3%) were lost. For the Northwest River in total, 0.44 smolt/km were lost. On the Southwest ...

2014 Smolt Estimate Report

The Miramichi River needs upwards of two million smolt migrating to the ocean every year in order to sustain a healthy adult population – roughly 1.2 million from the Southwest branch and 600,000 from the Northwest. The standard estimate is 3.0 smolt/100m2 . The three years of data from the Northwest system have shown variable and sometimes conflicting results. In 2011 and 2013 smolt production exceeded 3.0 smolt/100m2 and in 2012 was estimated at only 2.0 smolt/100m2 . Difficulties with equipment damage from weather and high water levels occurred during these years and may have impacted estimates. Earlier data from 2006 – 2010 on the Southwest system indicated that smolt production estimates exceeded ...

2014 Smolt Tracking Study

Survival numbers from the 2014 tagging study are less than desirable for the Miramichi River. The fish that successfully survived tagging (a 10% mortality rate is assumed for tagging studies) and were detected exiting Miramichi Bay was less than 15% from the Northwest branch. Only 50 smolts were tagged on the Northwest branch due to the minimum size required for tagging; the other smolts caught were too small. The highest areas of loss on the Northwest were from the tagging site at Miner’s Bridge to the first receiver at Big Hole Pole (9 fish went missing (adjusted for the poor receiver reception), or 18%) and from Loggieville to the estuary receivers (17 fish missing, or 34%). From Big Hole Pool to Cassilis ...

2013 Smolt Estimate Report

During the three year study of smolt on the Northwest Miramichi, estimates of juvenile production have varied considerably, with unexpected and sometimes confounding results. In 2011 and 2013 smolt production significantly exceeded 3.0 smolt/100m2 , considered the production target in to meet conservation requirements, by 50 and 100%, respectively. These values are surprising, as the years in which these fish were first produced had fewer adults than required to meet spawning requirement, which one might expect to to correlate to production below 3.0 smolt/100m2 . Furthermore, smolt production estimates from one-way mark recapture studies conducted in 2011 and 2012 on the tributaries used for tagging ... 

2012 Smolt Estimate Report

The Northwest Miramichi River had the lowest estimated smolt production despite this tributary generally producing adequate fry and parr density. One potential reason that smolt estimate may be low in this tributary is that the smolt wheel was not operational on May 11, which was the peak smolt movement date for the other two tributaries. Furthermore, May 12 was determined as the peak smolt movement day for the Northwest Miramichi River, so it is possible that May 11 may have also provided a high number of migrating smolt. Our objective to reach the 3.0 smolt per 100m2 smolt production target for the Miramichi was not exceeded on the Northwest Miramichi River system, as had been done in 2011. However, in 2012 ...

2011 Smolt Estimate Report

The Northwest Miramichi River as a whole, exceeded the smolt production target for the Miramichi River in 2011. We were surprised by this result as the numbers of adults returning to the river each year has generally been below the conservation requirements for the river. We were very surprised that the smolt production on the Sevogle, Northwest and Little Southwest Miramichi was low in 2011 with none of the rivers seemingly meeting the production targets, particularly since there were very high parr numbers on the Northwest and Sevogle Rivers, especially in the headwater areas. The largest problem we encountered was with the analysis of the smolt estimates. When the branch estimates were added, however they do not ...

2010 Smolt Estimate Report

Smolt production on the Southwest Miramichi and its tributaries may have been higher than previous years due to a relatively mild winter and early spring. The ice on the river this winter was not as thick as usual, and there was a minimal spring freshet during ice out due to low snowfall this winter. This may have translated to smolts experiencing less harsh conditions during the spring ice out, such as fewer ice jams and reduced discharges ect. Therefore smolt survival through the spring may have been higher than in previous years, hence the higher smolt production observed this spring compared to previous years. The data collected from this project over the past nine years has indicated that over the past five out of six years ...

2009 Smolt Estimate Report

The Cains smolt wheel operated from May 5 to June 2 and Dungarvon smolt wheel operated from May 6 to June 3, because of high water conditions within the tributaries. The estuary trap net at Millerton fished later, from May 14 to June 9, 2009, also because of high water conditions. The peak of the smolt run for the Cains River was May 17 and 65 smolts were captured. The peak of the smolt run on the Dungarvon River was May 11 with 750 smolts being captured that day. The peak of the smolt run in 2009 was more than a week earlier than 2008, possibly due to the large amount of rain we received which facilitated the warming of the river and movement of smolts. This year we tagged 557 smolts on the Cains and ...

2008 Smolt Estimate Report

The peak of the smolt run occurred on May 22nd for both the Cains and Dungarvon Rivers. This year we tagged 881 smolts on the Cains and 1223 smolts on the Dungarvon River. We estimated that 22,000 smolts moved from the Dungarvon River and 47,000 from the Cains River downstream to the ocean in the spring of 2008. The smolt production on the Dungarvon River in 2008 was the lowest record in the past 7 years, 22,000, well below the target production of 3.0 smolts per 100m2 of habitat (Table 1). Of the tagged fish 18 smolts from the Cains and 22 from the Dungarvon River were later recaptured at the trap net near the estuary at Millerton. We estimated a total smolt production of 914,000 smolts in the Southwest ...

2007 Smolt Estimate Report

The peak of the smolt run occurred on May 21st for both the Cains and Dungarvon Rivers. This year we tagged 859 smolts on the Cains and 2718 smolts on the Dungarvon River. We estimated that 70,000 smolts moved from the Dungarvon River and 56,000 from the Cains River downstream to the ocean in the spring of 2007. The smolt production on the Dungarvon River in 2007 was the highest ever recorded in the past 6 years, 48,000, exceeding the target production of 3.0 smolts per 100m2 of habitat (Table 1). Of the tagged fish 27 smolts from the Cains and 58 from the Dungarvon River were later recaptured at the trap net near the estuary at Millerton. We estimated a total smolt production of 1.34 million smolts in the ...

2006 Smolt Estimate Report

Salmon smolts tend to move in two peak times during the spring smolt run. The peaks of the smolt run on the Dungarvon River occurred on May 8 and 19th and on May 6 and 19, 2006 for the Cains River. This year we tagged 1381 smolts on the Cains and 1711 smolts on the Dungarvon River. We estimated that 98,000 smolts moved from the Cains River and 48,000 smolts moved from the Dungarvon River downstream to the ocean in the spring of 2006. The Cains river smolt production was higher in 2006 than 2002-2004, but the Dungarvon River was slightly lower than 2005 (Table 1). Of the tagged fish 14 smolts from the Cains and 73 from the Dungarvon River were later recaptured at the trap net near the estuary at Millerton. We ...